K-means Clustering and Visualization
April 22nd, 2014
One of the simplest machine learning algorithms that I know is K-means clustering. It is used to classify a data set into k groups with similar attributes and lets itself really well to visualization!
Here is a quick overview of the algorithm:
- Pick or randomly select k group centroids
- Group/bin points by nearest centroid
- Recalculate centroids from points in corresponding bin
- Continue binning/moving centroids until convergence
More information on K-means clustering
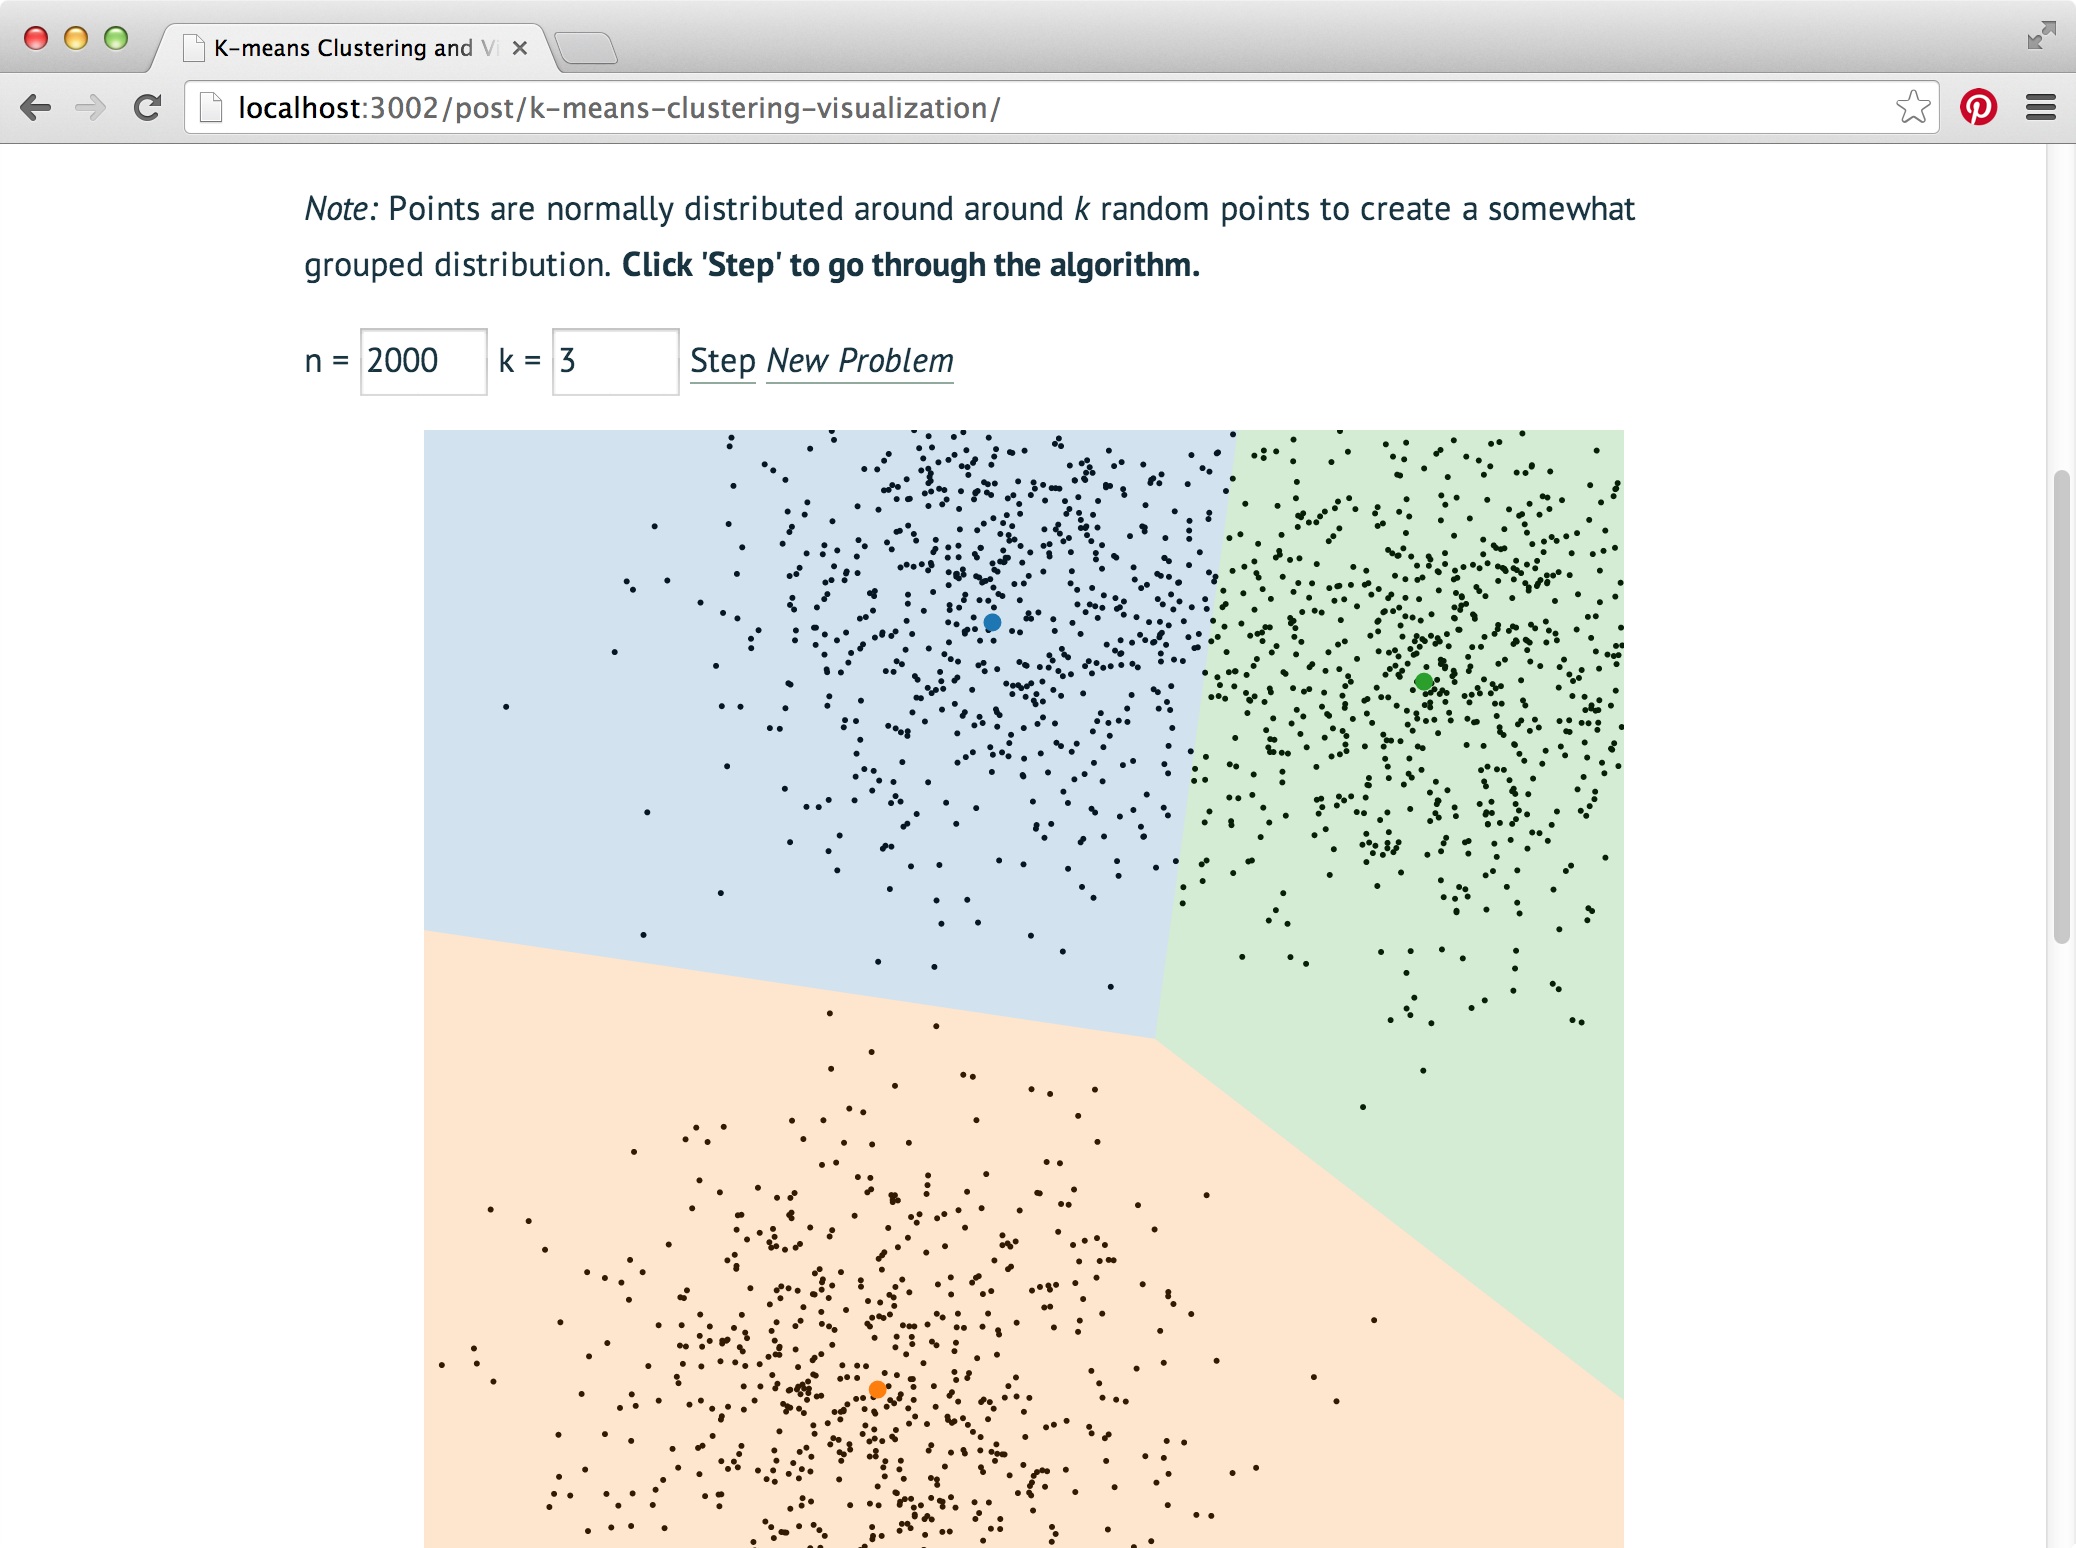
Note: Points are normally distributed around around k random points to create a somewhat grouped distribution. Click 'Step' to go through the algorithm.
n = k = Step New Problem
